JPMorgan Slide Needs Explanation
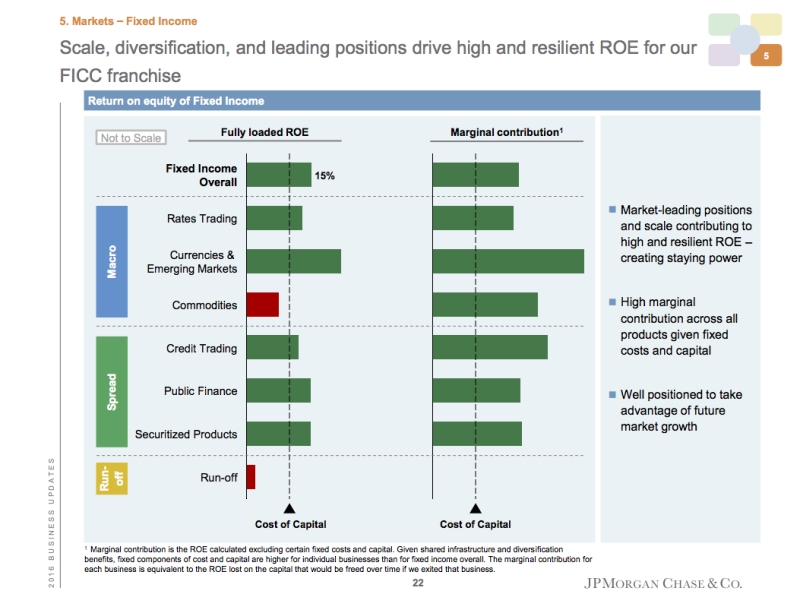
JPMorgan CEO Jamie Dimon and others didn't understand a slide about the bank's strategy. Daniel Pinto, head of the corporate and investment bank, presented the slide to Dimon and others. According to Business Insider, Dimon said of the chart: "no one understood, including myself at the time."
The slide is part of a longer presentation about the corporate and investment banking division. In an interview with Business Insider, Pinto explains the chart:
"This is fully loaded ROE for all the business lines in fixed income. This is what we produce. This line is the cost of capital, and every single business, on a fully loaded basis, is delivering a return ahead of the cost of capital, except for commodities, which is going through a process of adjustment. The most important part is if you were to eliminate one of those, not all of the capital goes away, not all of the cost goes away, so essentially the marginal impact, the ROE you would lose by closing the business, is far higher than 15%. That's why, for me, the completeness is very important."
Discussion:
- To what extent does Pinto's explanation help you understand the chart?
- Should an executive use a chart that's difficult to understand intuitively? What should you consider in making this decision? Consider the audience, setting, etc.
