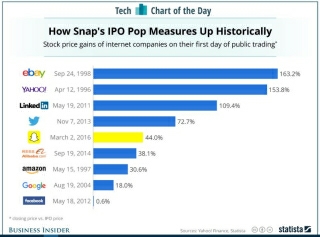
Snap in Charts
/Eric Spiegel, the founder of Snap Inc., is celebrating after a successful IPO that brought in $25 per share, a market value of $33 billion, and enough to bring his net worth to $6 billion, making him wealthier than Richard Branson, Donald Trump, and Oprah.
It's not the largest IPO, but the numbers are surprising, given that Snapchat is essentially an app, and 98% of its revenue comes from advertising. MarketWatch also reports losses:
Snap recorded $404.5 million in revenue in 2016, compared with $58.7 million in 2015. Net losses grew to $514.6 million in 2016, compared with a net loss of $372.9 million in 2015. Like many burgeoning tech startups, Snap warned that it "may never achieve or maintain profitability."
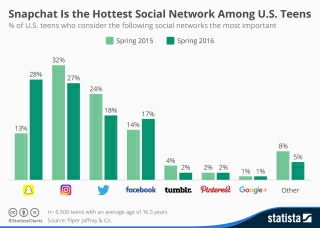
Still, the ad revenue is solid because of Snapchat's popularity with teens. As the second chart shows, Snapchat is highly popular and has seen a lot of growth between 2015 and 2016. 
IPO image source and teen use image source.
Discussion:
- What principles for chart design from Chapter 9 are demonstrated in these two examples?
- What would you change about these charts to make them more effective?
- What 2017 data can you find about Snapchat? Create a new comparison chart.


